카페검색 본문
카페글 본문
-
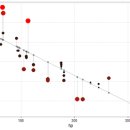
R 그래프 : Regression Residual Plot 2020.04.01해당카페글 미리보기
fit <- lm(mpg ~ wt, data = d) # fit the model d$predicted <- predict(fit) # Save the predicted values d$residuals <- residuals(fit) # Save the residual values ggplot(d, aes(x = wt, y = mpg)) + geom_smooth(method = "lm", se = FALSE, color...
-
Re:넘넘 급합니다...... 회귀분석 2003.11.25해당카페글 미리보기
1) 메탄의 양(Y) : 종속변수 광산의 깊이(X) : 독립변수 2) 위의 회귀식에 기초하여, residuals과 predicted values의 값들을 구하고,e 와 Yhat에 대한 plot을 그려보시오. : spss옵션부분을 체크하시면 자동으로 출력됩니다. 새로 출력된 변수를 이용하여...
-
회귀분석에서 가설검정 2016.03.26해당카페글 미리보기
13.5777 0.6227 0.3124 -0.1870 > summary(out) Call: lm(formula = rating ~ complaints + learning + advance, data = attitude) Residuals: Min 1Q Median 3Q Max -12.217 -5.377 0.967 6.078 11.540 Coefficients: Estimate Std. Error t value Pr(>|t...
-
proc varmax에 관한 질문입니다. 답변 부탁드려요 ㅠㅠ 2007.01.06해당카페글 미리보기
시행했습니다. proc reg data=kim; where t>=139 and t<=201; model leading_rate=trans2_stock14/r; output out=residuals r=resid; run; %dftest(residuals,resid,dif=(0),dlag=1, outstat=kimout1); proc print data=kimout1;run; => 전반적인 플롯은...
-
지식인 글을 보고 찾아왔습니다(잔차의 정규성 검정) 2011.05.12해당카페글 미리보기
of Variance Table Response: weight Df Sum Sq Mean Sq F value Pr(>F) group 2 3.7663 1.8832 4.8461 0.01591 * Residuals 27 10.4921 0.3886 --- Signif. codes: 0 ‘***’ 0.001 ‘**’ 0.01 ‘*’ 0.05 ‘.’ 0.1 ‘ ’ 1 # 회귀진단 > par(mfrow=c(2...
-
One-way ANOVA 2009.12.30해당카페글 미리보기
5.526 ### lm() 결과물 > summary(lm(weight~group,data=PlantGrowth)) Call: lm(formula = weight ~ group, data = PlantGrowth) Residuals: Min 1Q Median 3Q Max -1.0710 -0.4180 -0.0060 0.2627 1.3690 Coefficients: Estimate Std. Error t value Pr...
-
의식수준을 넘어서/ 깨달음의 역학 2010.08.19해당카페글 미리보기
and belief systems. The requirement is the persistent 'one-pointedness of mind' processing-out of emotional/mental residuals of lower consciousness levels and surrendering of all self-identities and supported by the unimpeded inflow of...
-
11.28코드(2018) 삼원배치 R코드 2016.11.27해당카페글 미리보기
1.000 A.fac:B.fac 1 24.5 24.5 0.605 0.579 B.fac:C.fac 1 18.0 18.0 0.444 0.626 A.fac:C.fac 1 60.5 60.5 1.494 0.437 Residuals 1 40.5 40.5 > anova(L) Analysis of Variance Table Response: yield Df Sum Sq Mean Sq F value Pr(>F) A.fac 1 760.5...
-
R의 Output에서 특정 값을 추출하는 방법을 문의드립니다 2016.08.28해당카페글 미리보기
X6 ~ 1 + X7 + (1 + X7 | st1/id) Data: last_uncon_5_20_100_45 REML criterion at convergence: 58372.3 Scaled residuals: Min 1Q Median 3Q Max -3.3038 -0.5611 0.0033 0.5524 3.0949 Random effects: Groups Name Variance Std.Dev. Corr id:st1...
-
Simple Linear Regression 2009.12.30해당카페글 미리보기
cars를 이용 ### lm() 결과물 > summary(lm(dist~speed, data=cars)) Call: lm(formula = dist ~ speed, data = cars) Residuals: Min 1Q Median 3Q Max -29.069 -9.525 -2.272 9.215 43.201 Coefficients: Estimate Std. Error t value Pr(>|t...