카페검색 본문
카페글 본문
-
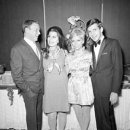
1967년, 프랭크 시나트라의 20대 아들과 딸이 부릅니다 - Something Stupid 2024.06.29해당카페글 미리보기
it's just a line to you For me it's true And never seemed so right before I practice every day To find some clever lines to say To make the meaning come true But then I think I'll wait Until the evening gets late And I'm alone with you...
-
그들은 컴퓨터를 작동시키기 위해 "오가노이드"라고 불리는 실험실에서 성장한 인간의 뇌를 사용하고 있다. 2024.06.29해당카페글 미리보기
may be a way to save a lot of energy, but it also perfectly illustrates how far our society has fallen. We are crossing lines that should never be crossed, and eventually we will pay a very great price for the crimes that our scientists...
-
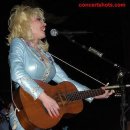
Detroit City - Dolly Parton 2024.06.29해당카페글 미리보기
they think I'm fine By day I make the cars But, by night I make all the bars Oh if only they's just read between the lines 친척들은 내가 디트로이트에서 크게 성공한 줄 알고 있거든요. 내가 보낸 편지를 보고 그들은 내가 잘 있다고 생각해요...
-
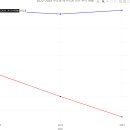
Re: 오늘의 마지막 문제. 오늘 그린 그래프들을 이용해서 SQL 포트폴리오 데이터를 이용해서... 2024.07.02해당카페글 미리보기
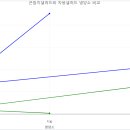
x= ~year, y = ~total, color = ~area, colors = c('red','blue'), marker = list(color = 'black'), type = 'scatter', mode = 'lines+markers') # 7. 그래프 타이틀명 추 fig <- fig %>% layout(title = '2022-2024 수도권 비수도권 인구 추이 현황...
-
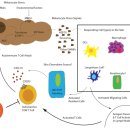
백반증 .. T 세포 매개 자가면역질환... 2024.06.28해당카페글 미리보기
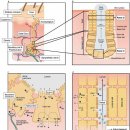
patients have a dilated ER (22), a tell-tale sign of ER stress, and intracellular staining of equally aged cell lines suggests there is dysregulation of protein expression (26), a precipitating factor that can initiate ER stress. We have...
-
Re: 오늘의 마지막 문제. 오늘 그린 그래프들을 이용해서 SQL 포트폴리오 데이터를 이용해서... 2024.07.02해당카페글 미리보기
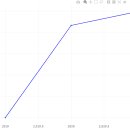
rbind(c_21, c_20) c_data d_data <- rbind(c_data, c_19) d_data # 라인 그래프 생성 fig <- plot_ly(d_data, x = ~year) %>% add_trace(y = ~Tot_Suplr_Srvcs, type = 'scatter', mode = 'lines+markers', line = list(color = 'blue')) # 그래프 출력 fig
-
Re: 오늘의 마지막 문제. 오늘 그린 그래프들을 이용해서 SQL 포트폴리오 데이터를 이용해서... 2024.07.02해당카페글 미리보기
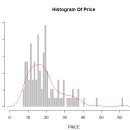
seq(0,70,by=1), col="grey", border="white", prob=T, xlab = 'PRICE', ylim=c(0, 0.1), main='Histogram Of Price') lines( density(aprice), col="red") # 산점도 #산점도 그래프 그리기 fig <- plot_ly( data = cars93, x = ~Price, y = ~MPG.highway...
-
Re: 오늘의 마지막 문제. 오늘 그린 그래프들을 이용해서 SQL 포트폴리오 데이터를 이용해서... 2024.07.02해당카페글 미리보기
a, x = ~year, y = ~total_birth, color = ~com_size, colors = c('blue', 'red','gold','purple'), type = 'scatter', mode = 'lines+markers') # 그래프 레이아웃 설정 fig <- fig %>% layout(title = '사업장 규모별 출산수', xaxis = list(title...
-
땀에 관한 탐구!! 2024.06.25해당카페글 미리보기
in the onset (threshold) and sensitivity (slope) of the sweating response to hyperthermia are depicted by the dashed lines. Other potential factors that may directly or indirectly modify sweating (altitude/hypoxia, microgravity...
-
Re: 오늘의 마지막 문제. 오늘 그린 그래프들을 이용해서 SQL 포트폴리오 데이터를 이용해서... 2024.07.02해당카페글 미리보기
food_s[1,'탄수화물'], food_s[1,'단백질'], food_s[1,'지방']), name = food_s[1, "식품명"], type = 'scatter', mode = 'lines+markers', line = list(color = 'blue'), marker = list(color = 'blue') ) %>% add_trace( x = c("탄수화물", "단백질...