카페검색 본문
카페글 본문
-
★ 리아츠 더 인천 ★ 2024.07.02해당카페글 미리보기
조망과 상징성을 갖춘 송림의 독보적 랜드마크, 선호도 높은 아파트 전용면적 59㎡A⚬B⚬C, 74㎡, 84㎡A⚬B, 오피스텔 42㎡A⚬B Type 혁신 평면구조로 구성하였습니다. 아울러, 현관 자동중문(3연동 슬라이딩), 세라믹타일(주방상판⚬주방벽), 가변형벽체 설치...
-
Re: 오늘의 마지막 문제. 오늘 그린 그래프들을 이용해서 SQL 포트폴리오 데이터를 이용해서... 2024.07.02해당카페글 미리보기
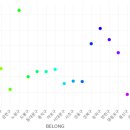
x = ~ BELONG, y = ~ totalcap_summary, color = ~ BELONG, colors = rainbow(length(unique(totalcap_summary_df$BELONG))), type = 'scatter', mode = 'markers', marker = list(size = 10) ) %>% layout( xaxis = list( tickangle = -45 ) ) # 그래프...
-
Re: 오늘의 마지막 문제. 오늘 그린 그래프들을 이용해서 SQL 포트폴리오 데이터를 이용해서... 2024.07.02해당카페글 미리보기
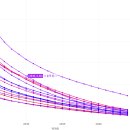
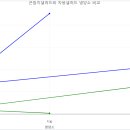
gna 3. plotly 패키지 로드 library(plotly) 4. plotly를 사용한 라인 그래프 생성 fig <- plot_ly(gna, x = ~YEAR, y = ~소멸위험지수, color = ~도시, colors = c('red','purple','blue'), type = 'scatter', mode = 'lines+markers') 5. 그래프 출력 fig
-
참父母經 / Chambumo Gyeong - 392. 종교유엔과 초종교초국가평화의회 2024.07.02해당카페글 미리보기
requested that the participants do their best for the Interreligious and International Peace Council, which is a new type of UN and represents a new hope. 1 I am planning to create a UN of religions. My suggestion to them is that...
-
Re: 오늘의 마지막 문제. 오늘 그린 그래프들을 이용해서 SQL 포트폴리오 데이터를 이용해서... 2024.07.02해당카페글 미리보기
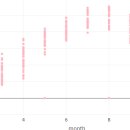
fig <- plot_ly(jn_rn_3, x = ~평균기온, y = ~month, colors = c("gold","lightpink","tomato","lightgreen","paleturquoise"), type = 'scatter', mode = 'lines+markers') #산포도 그래프 fig <- plot_ly(data = jn_rn_3, x = ~month, y = ~평균기온...
-
Re: 오늘의 마지막 문제. 오늘 그린 그래프들을 이용해서 SQL 포트폴리오 데이터를 이용해서... 2024.07.02해당카페글 미리보기
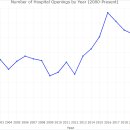
7. 라인 그래프 생성 fig <- plot_ly(yearly_open_count, x = ~year) %>% add_trace(y = ~open_count, name = '병원 개원 수', type = 'scatter', mode = 'lines+markers', line = list(color = 'blue')) %>% layout(title = 'Number of Hospital Openings...
-
Re: 오늘의 마지막 문제. 오늘 그린 그래프들을 이용해서 SQL 포트폴리오 데이터를 이용해서... 2024.07.02해당카페글 미리보기
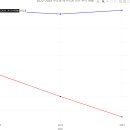
fig <- plot_ly(pop1, x= ~year, y = ~total, color = ~area, colors = c('red','blue'), marker = list(color = 'black'), type = 'scatter', mode = 'lines+markers') # 7. 그래프 타이틀명 추 fig <- fig %>% layout(title = '2022-2024 수도권...
-
Re: 오늘의 마지막 문제. 오늘 그린 그래프들을 이용해서 SQL 포트폴리오 데이터를 이용해서... 2024.07.02해당카페글 미리보기
생성 fig <- plot_ly(a, x = ~year, y = ~total_birth, color = ~com_size, colors = c('blue', 'red','gold','purple'), type = 'scatter', mode = 'lines+markers') # 그래프 레이아웃 설정 fig <- fig %>% layout(title = '사업장 규모별 출산수...
-
Re: 오늘의 마지막 문제. 오늘 그린 그래프들을 이용해서 SQL 포트폴리오 데이터를 이용해서... 2024.07.02해당카페글 미리보기
단백질", "지방"), y = list(food_s[1,'탄수화물'], food_s[1,'단백질'], food_s[1,'지방']), name = food_s[1, "식품명"], type = 'scatter', mode = 'lines+markers', line = list(color = 'blue'), marker = list(color = 'blue') ) %>% add_trace( x...
-
Re: 오늘의 마지막 문제. 오늘 그린 그래프들을 이용해서 SQL 포트폴리오 데이터를 이용해서... 2024.07.02해당카페글 미리보기
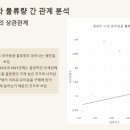
fig <- plot_ly() # 첫 번째 그룹 추가 (점의 색깔: '#d3c5b6') fig <- fig %>% add_trace(data=baby_data[1:4, ], x=~영유아수, y=~유아용품수, type='scatter...