카페검색 본문
카페글 본문
-
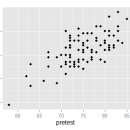
plot 함수를 이용해서 scatter plot을 만들려고 합니다 2009.11.15해당카페글 미리보기
b=read.table("/Users/cunghyeonyu/b.txt", col.names=c("name","count")) > > c=merge(a,b, by="name", all=T) > > plot(1:dim(c)[1], rep(max(c$count.x, c$count.y, na.rm=T),dim(c)[1]), + type="n", ylab="Count", ylim=c(0, max(c$count.x, c$count...
-
scatter plot 해석 도움이 필요합니다. 2008.07.17해당카페글 미리보기
제가 scatter plot을 그려봤는데 해석하는데 어려움이 있습니다. 세 개의 plot 가운데 첫번째는 그려진 선을 보고 negative relation이 있다고 말할 수가 있나요? 그리고 그 선에 가까이 있는 나라들이 몇개 없는데 두 변수간의 관계가 있다고 판단할 수...
-
R 그래프 : scatter plot 2015.02.06해당카페글 미리보기
때문이다. 그래서 xy graph라고도 한다. X,Y 변수를 설명하는 그래프!! http://www.statmethods.net/graphs/scatterplot.html http://www.r-bloggers.com/scatterplot-matrices-in-r/ http://r4stats.com/examples/graphics-ggplot2/ scatter plot matrix다
-
scatter plot 그릴때 혼란변수 효과보정이 가능한가요? 2009.04.23해당카페글 미리보기
할 때, partial 뒤에 variable을 붙이면, 그 변수의 효과를 제거한 (보정한) 상관분석 결과를 확인할 수 있쟎아요.. 혹시 scatter plot을 그릴때, 이렇게 어떤 혼란변수의 효과를 보정한 산점도를 그리는 게 가능한가 해서요.. 예를 들어 x 는 혈액검사...
-
칼로리 제한, 공복이 인체 건강 유익한 효과 통시적 탐구!! 2026.07.01해당카페글 미리보기
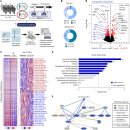
단식의 대사적(케톤) vs 전체 에너지 부족(체중) 효과를 구분하는 데 핵심적입니다. 패널별 해석 A. Association Z-score scatter plot (BHB vs Weight) x축: BHB 변화와의 연관성 (Z-score). y축: 체중 변화와의 연관성 (Z-score). 색상: 녹색: BHB와...
-
24억년 전 '단세포 생명(원핵세포)' --> 다세포 생명(진핵세포)로 진화과정 탐구 2026.06.26해당카페글 미리보기
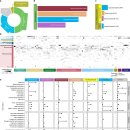
전략(trophic strategy)에 따른 LECA로부터 물려받은 단백질 비율 d: LECA로부터 물려받은 단백질 비율 vs 단백질 수 scatter plot (a) 대사 경로 네트워크 – 가장 중요한 부분 색상별로 주요 대사 경로를 연결한 복잡한 네트워크 지도입니다. 파랑 계열...
-
Motivational Variability of Second Language Learning and Self-Regulation 2026.08.27해당카페글 미리보기
across school years, with particular attention to four key participants. Based on motivation patterns and a scatter plot of average motivation and standard deviation, participants were categorized into two contrastive focal profiles...
-
Stata tip 136: Between-group comparisons in a scatterplot with weighted... 2024.01.03해당카페글 미리보기
Stata tip 136: Between-group comparisons in a scatterplot with weighted markers
-
명상 --> 뇌재생 효과 .. 통시적 탐구.. 2026.06.17해당카페글 미리보기
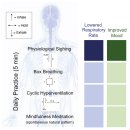
interoception), 감정·신체 감각 처리와 밀접한 영역. 빨간색/주황색: 명상군에서 피질이 두꺼운 부위. (b) 산점도 (Scatter Plot) X축: 호흡률 변화 (Change in breathing rate, bpm) — 명상 시 호흡이 느려지는 정도. Y축: 해당 뇌 영역의 피질 두께...
-
PI(perfusion index) 유용성, 산소포화도와 관련성 .. 최신논문 탐구!! 2026.05.01해당카페글 미리보기
pulse oximeter (finger probe) + Radiometer ABL 800 co-oximetry. 분석: PI를 3군으로 범주화: <0.6, 0.6–3, >3 (scatter plot 기반 variation 변화점). Bland-Altman analysis, bias, limits of agreement (LoA). Clinically significant discrepancy...